
Data Catalogue
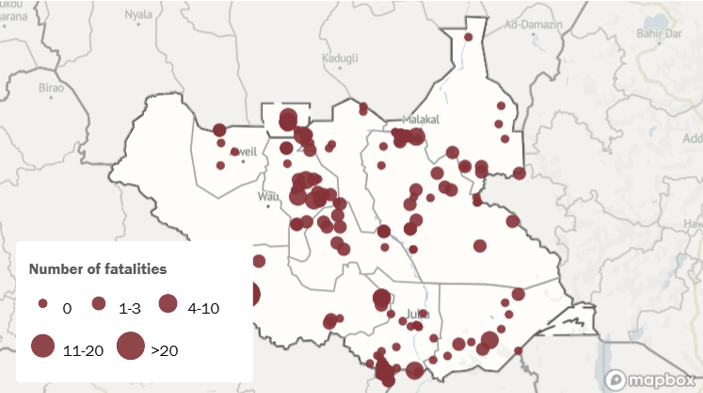
All Conflict Events / Security Threats
What it measures: The occurrence and severity of conflict events within a specific area.
How it’s constructed: Constructed from Armed Conflict Location & Event Data (ACLED)-reported events, capturing frequency, geographic location, timing, event types, and fatalities, based on media and secondary reporting.
Aggregation: Monthly, at latitude/longitude level (for maps) and administrative level 1, state or province (for time trends).
Source: ACLED (Raleigh et al. 2023).
- Spatial & temporal coverage: Global, 1997 - present; consistent global coverage since 2018.
- Spatial & temporal resolution: Location-specific, daily.
- Update frequency: Approximately weekly.
- Latency: Approximately one-week lag.
- Format: CSV.
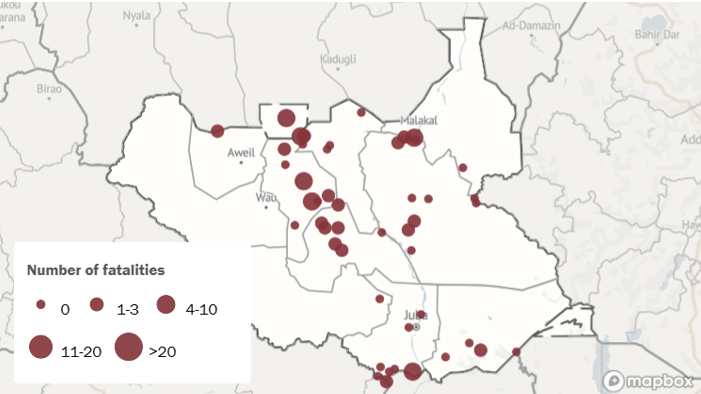
Resource-related Conflict Events / Security Threats
What it measures: Incidents linked to economic activities (livestock, farming, fishing, forestry) and production factors (land, water) related to selected natural resources.
How it’s constructed: Identified through keyword searches in ACLED event descriptions, targeting disputes over these activities and resources. All identified cases are manually reviewed to minimise false positives.
Aggregation: Monthly, at latitude/longitude level (for maps) and administrative level 1 (for time trends).
Source: ACLED (Raleigh et al. 2023).
- Spatial & temporal coverage: Global, 1997 - present; consistent global coverage since 2018.
- Spatial & temporal resolution: Location-specific, daily.
- Update frequency: Approximately weekly.
- Latency: Approximately one-week lag.
- Format: CSV.
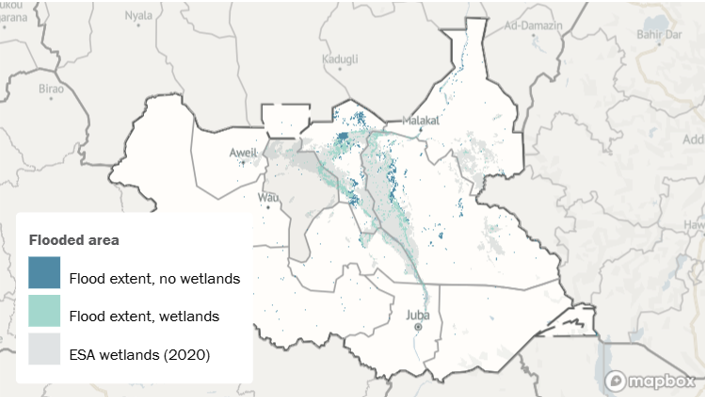
Flooding / Agriculture & Climate
What it measures: The extent of flood within a specific area.
How it’s constructed: A pixel is considered flooded if at least 70 per cent of a pixel is inundated at least once in a month. Flooded areas inside and outside of wetlands are distinguished using European Space Agency (ESA) land cover data, reclassified according to the Intergovernmental Panel on Climate Change (IPCC) conversion guidelines.
Aggregation: Monthly, at pixel level (for maps) and administrative level 1 (for time trends).
Source 1: National Oceanic and Atmospheric Administration (NOAA) Visible Infrared Radiometer Suite (VIIRS) flood data (Sanmei et al. 2017).
- Spatial & temporal coverage: Global, 2012 – present.
- Spatial & temporal resolution: 375 m, five-day composites.
- Update frequency: Daily.
- Latency: One to two days.
- Format: Raster (.tif).
Source 2: WorldPop.
- Spatial & temporal coverage: Global, 2000 – present.
- Spatial & temporal resolution: ~100m (≈ 3 arc-seconds) gridded population estimates, annual.
- Update frequency: Annually (with additional country-level updates as new census/survey data become available).
- Latency: Typically one to three years, depending on census release and integration into WorldPop.
- Format: Raster (GeoTIFF), with derivative datasets also available in ASCII and NetCDF.
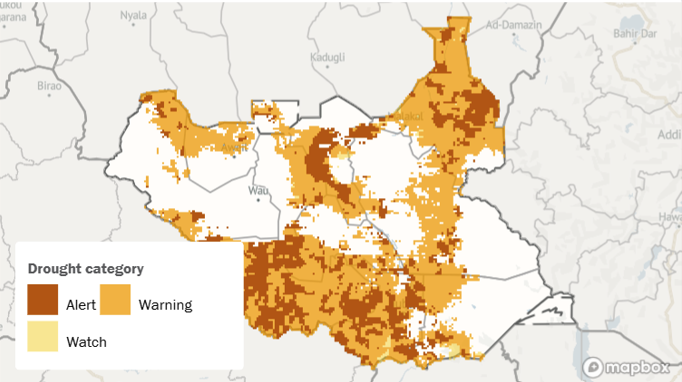
Drought / Agriculture & Climate
What it measures: Drought severity, classified into three categories (Watch, Warning, Alert), based on precipitation deficits, soil moisture anomalies, and vegetation stress.
How it’s constructed: Calculated using the Combined Drought Indicator (CDI), which integrates the Standardized Precipitation Index (SPI), soil moisture anomalies (SMA), and vegetation stress (FAPAR) to capture meteorological and agricultural drought impacts, following Copernicus and Intergovernmental Authority on Development (IGAD) Climate Prediction & Applications Centre (ICPAC) guidelines.
Aggregation: Monthly, at pixel level (for maps) and administrative level 1 (for time trends).
Source 1: SPI - see variable Standardized Precipitation Index.
Source 2: SMA - see variable Soil Moisture.
Source 3: FAPAR - see variable Vegetation.
Source 4: WorldPop - see variable Flooding.
Standardized Precipitation Index / Drought / Agriculture & Climate
What it measures: Precipitation anomalies at a given location, based on a comparison of observed total precipitation amounts for accumulation periods of interest (one, three, nine, twelve months) with the long-term historic rainfall record for those periods.
How it’s constructed: Historical rainfall data (1981-2010) is modeled using a probability distribution (gamma distribution), which is then converted into a normal distribution so that the average SPI value for that location and time period equals zero (following World Meteorological Organization (WMO) guidelines). For any region, values below -1.0 indicate increasingly severe rainfall shortages (meteorological droughts), while values above 1.0 indicate increasingly severe rainfall surpluses.
Aggregation: Monthly, at pixel level.
Source: CHIRPS – see variable precipitation.
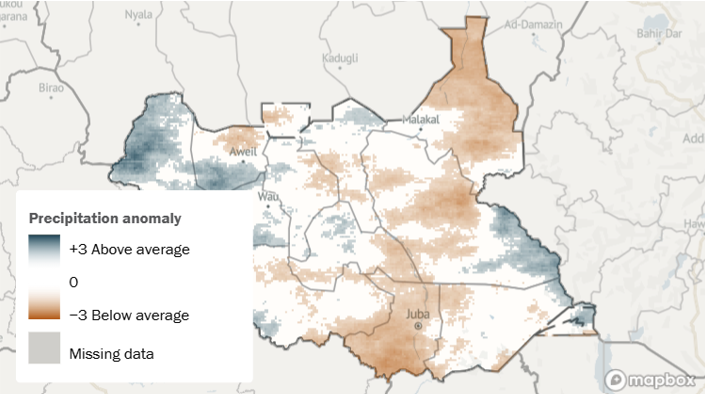
Precipitation / Agriculture & Climate
What it measures: Precipitation anomalies, i.e. deviations from the long-term monthly mean.
How it’s constructed: Values are expressed as z-scores, calculated against the 1991-2020 reference period.
Aggregation: Monthly, at pixel level (for maps) and administrative level 1 (for time trends).
Source: Climate Hazards Group InfraRed Precipitation with Station (CHIRPS) (Funk et al. 2015)
- Spatial & temporal coverage: Global, 1981 - present.
- Spatial & temporal resolution: 0.05° (~5 km), monthly.
- Update frequency: Monthly.
- Latency: One month (preliminary files available with no lag).
- Format: Raster (.tif).
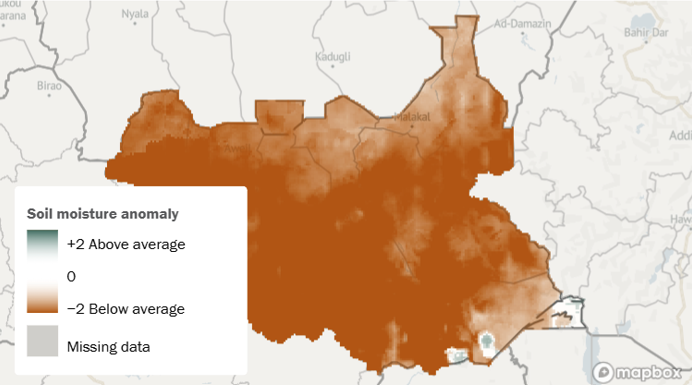
Soil Moisture / Agriculture & Climate
What it measures: Anomalies, i.e. deviations from the long-term monthly mean in the soil water content in the root zone.
How it’s constructed: Anomaly values are provided by the Joint Research Centre (JRC)’s Global Drought Observatory (GDO) at the dekad level (10-day periods), which are aggregated to the monthly level. Values are expressed as z-scores, calculated against the 1995-2024 reference period.
Aggregation: Monthly, at pixel level (for maps) and administrative level 1 (for time trends).
Source: JRC GDO Ensemble Soil Moisture Anomaly (v2.3.0, 2021).
- Spatial & temporal coverage: Global, 1995 – present.
- Spatial & temporal resolution: 0.1°, ten-day composites.
- Update frequency: Every ten days.
- Latency: Approximately one week.
- Format: Raster (.tif).
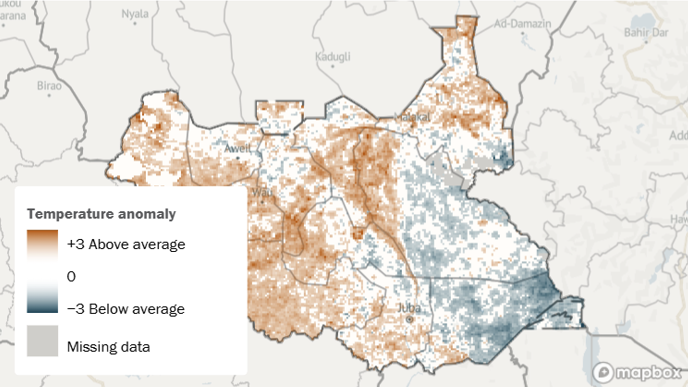
Temperature / Agriculture & Climate
What it measures: Land Surface Temperature (LST) anomalies, i.e. deviations from the long-term monthly mean.
How it’s constructed: Values are expressed as z-scores, calculated against the 2002–2024 reference period.
Aggregation: Monthly, at pixel level (for maps) and administrative level 1 (for time trends).
Source: NASA Moderate resolution imaging spectroradiometer (MODIS) LST (MYD21C3v061; Hulley & Hook 2021).
- Spatial & temporal coverage: Global, July 2002 – present.
- Spatial & temporal resolution: 0.05° (~5 km), monthly.
- Update frequency: Monthly.
- Latency: One month.
- Format: HDF5.
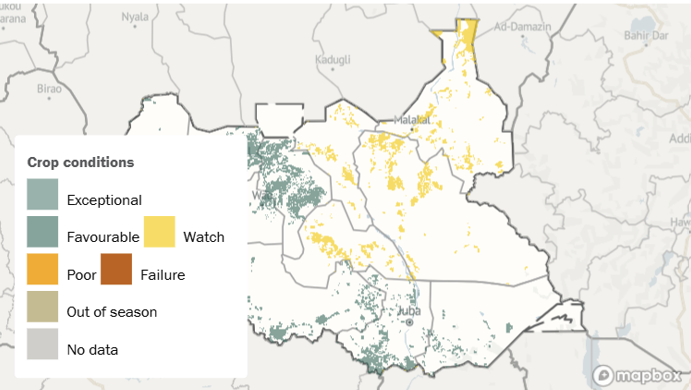
Crop Conditions / Agriculture & Climate
What it measures: Conditions for a selection of key crops (maize, millet, rice, sorghum, wheat), classified into six categories (Exceptional, Favourable, Poor, Watch, Failure, Out of Season), based on the average conditions over the past five years relative to expected yields, as detailed in the Crop Monitor’s Methodology.
How it’s constructed: Crop conditions are taken directly from the Crop Monitor’s classifications.
Aggregation: Monthly, at pixel level (for maps) and administrative level 1 (for time trends).
- Source: Group on Earth Observations Global Agricultural Monitoring (GEOGLAM) Crop Monitor (2025). Licensed under CC BY 4.0.
- Spatial & temporal coverage: Global, 2020 - present.
- Spatial & temporal resolution: 0.01°, monthly.
- Update frequency: monthly.
- Latency: Approximately two weeks.
- Format: Raster (.tif).
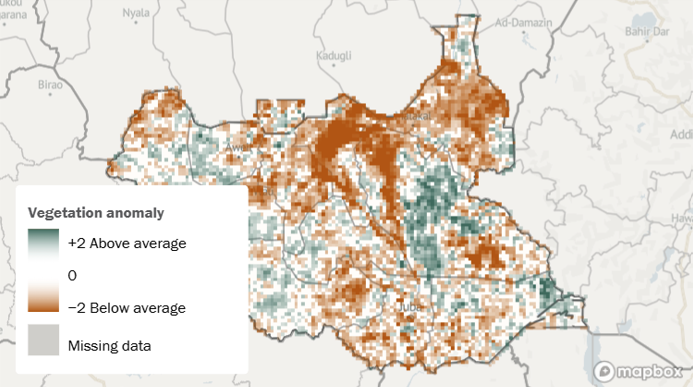
Vegetation / Agriculture & Climate
What it measures: Anomalies, i.e. deviations from the long-term monthly mean in the Fraction of Absorbed Photosynthetically Active Radiation (FAPAR), a proxy for vegetation condition.
How it’s constructed: Anomaly values are provided by JRC GDO at the dekad level and are aggregated to the monthly level. Values are expressed as z-scores, calculated against the 2012–2024 reference period.
Aggregation: Monthly, at pixel level (for maps) and administrative level 1 (for time trends).
Source: JRC GDO VIIRS FAPAR (2022, v3.0.0).
- Spatial & temporal coverage: Global, 2012 - present.
- Spatial & temporal resolution: 0.1°, ten-day composites.
- Update frequency: Every ten days.
- Latency: Approximately one week.
- Format: Raster (.tif).
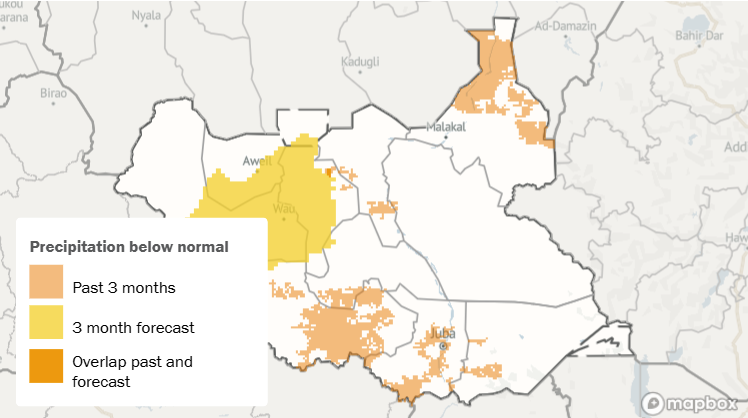
Precipitation Forecasts / Agriculture & Climate
What it measures: Areas with sustained precipitation deficits or surpluses, combining anomalies from the past three months with forecasts for the next three months.
How it’s constructed: We identify areas with at least three consecutive months of extreme precipitation (highest/lowest quartile). Then we determine which of these are forecasted to experience below/above average precipitation in the next quarter, with a probability of at least 45 per cent. Calculations follow the World Bank’s approach.
Aggregation: Monthly, at pixel level (for maps).
Source 1: ICPAC, Seasonal Precipitation Forecasts.
- Spatial & temporal coverage: Regional (IGAD countries), 2020 – present.
- Spatial & temporal resolution: 0.5°, three-month forecasts.
- Update frequency: Monthly.
- Latency: Two weeks.
- Format: Raster (.tif).
Source 2: Precipitation persistence - see variable precipitation
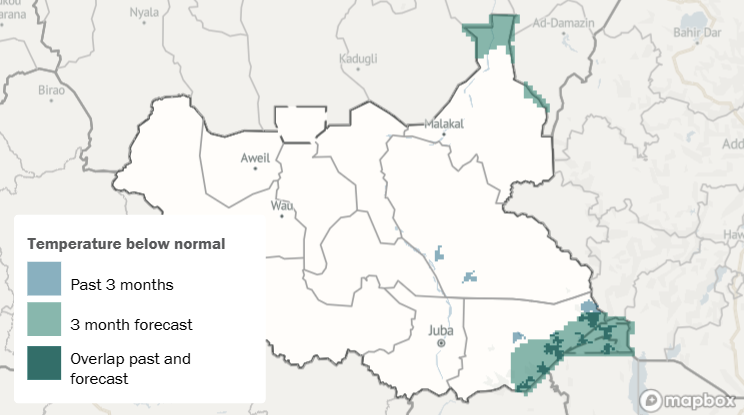
Temperature Forecasts / Agriculture & Climate
What it measures: Areas with sustained temperature deficits or surpluses, combining anomalies from the past three months with forecasts for the next three months.
How it’s constructed: We identify areas with at least three consecutive months of extreme temperature (highest/lowest quartile). Then we determine which of these are forecasted to experience below/above average temperature in the next quarter, with a probability of at least 45 per cent. Calculations follow the World Bank’s approach.
Aggregation: Monthly, at pixel level (for maps).
Source 1: ICPAC, Seasonal Temperature Forecasts
- Spatial & temporal coverage: Regional (IGAD countries), 2020 – present.
- Spatial & temporal resolution: 0.5°, three-month forecasts.
- Update frequency: Monthly.
- Latency: Two weeks.
- Format: Raster (.tif).
Source 2: Temperature persistence – see variable temperature.
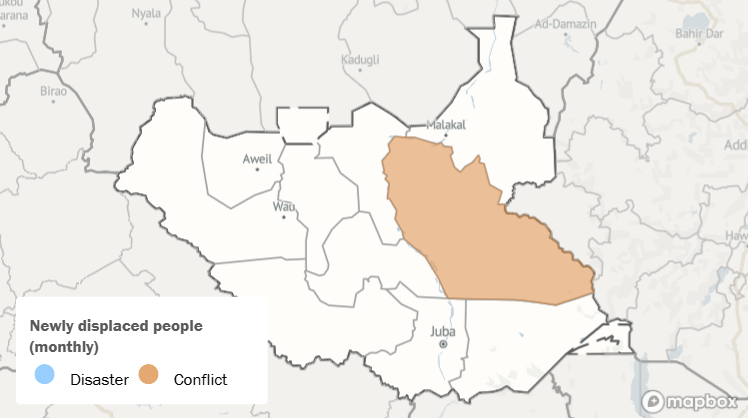
Displacement / Humanitarian Impacts
What it measures: Newly displaced people within a specific area and by primary driver (conflict, disaster).
How it’s constructed: Based on the Internal Displacement Monitoring Centre’s (IDMC) displacement reporting, combined with the Internal Displacement Updates (IDU) for the past 180 days with the streamlined Global Internal Displacement Database (GIDD) for previous periods.
Aggregation: Monthly, at the administrative level 1 (for maps).
Source 1: Internal Displacement Updates (IDU, IDMC, 2025).
- Spatial & temporal coverage: Global, past 180 days.
- Spatial & temporal resolution: Latitude/longitude, daily.
- Update frequency: Daily, with possible retrospective updates.
- Latency: Near real-time.
- Format: CSV.
Source 2: Global Internal Displacement Database (GIDD, IDMC, 2008–2024).
- Spatial & temporal coverage: Global, 2008–2024.
- Spatial & temporal resolution: National, yearly.
- Update frequency: Yearly.
- Latency: Approximately four months.
- Format: CSV.
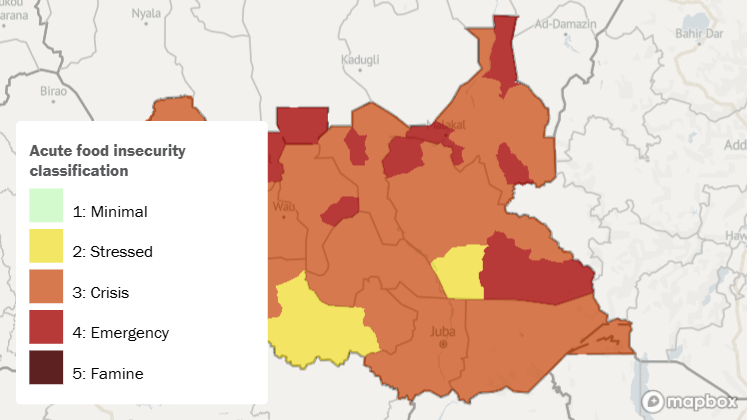
Food Insecurity / Humanitarian Impacts
What it measures: Acute food insecurity phases, disaggregated by population and administrative units, current and projection for the next three months, according to Integrated Food Security Phase Classification (IPC) standard classification.
How it’s constructed: Food insecurity levels reflect those in the raw data.
Aggregation: Monthly, at the administrative level 2 (for maps).
Source 1: Famine Early Warning Systems Network (FEWS NET).
- Spatial & temporal coverage: Selected countries, 2009 – present.
- Spatial & temporal resolution: Administrative level 2, monthly.
- Update frequency: Monthly.
- Latency: Approximately one month.
- Format: Shapefile.
Source 2: IPC Population Tracking Tool. Integrated Food Security Phase Classification.
- Spatial & temporal coverage: Selected countries, 2017 to present.
- Spatial & temporal resolution: Administrative level 2, various temporal resolutions.
- Update frequency: Infrequent, at least yearly.
- Latency: Varies.
- Format: .xslx
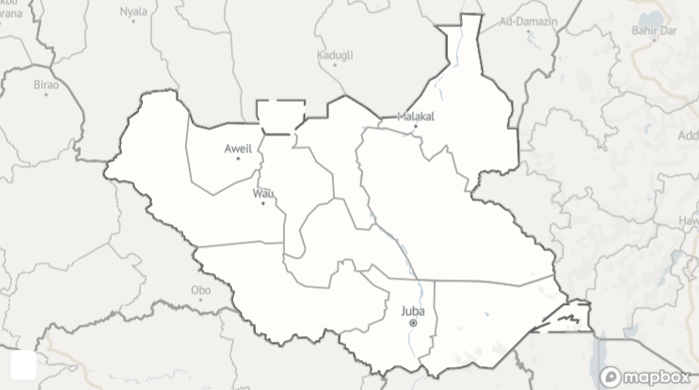
Administrative boundaries
What it measures: Administrative boundaries at the administrative level 0 (country), administrative level 1 (state, province) and administrative level 2 (district, county).
How it’s constructed: Data from fieldmaps, which is partly based on OpenStreetMap and verified by Crisis Group’s country analysts.
Aggregation: Administrative level 2.
Source 1: Fieldmaps (Max Malynowsky, 2025).
- Update frequency: Regularly updated.
- Format: Geodatabase (.gdb).
Source 2: OpenStreetMap. Open Data Commons Open Database License (ODbL).
- Update frequency: Regularly updated.
- Format: Web Map Service (OSM via Mapbox).
Website Updates:
September 15, 2025: Public launch, eEARTH v1, Horn of Africa
October 10, 2024: Soft launch, eEARTH prototype, South Sudan
Reusing any or all of the data or information provided on this site must comply with our Copyright & Trademark Policy.
Photo Credit: This aerial view shows makeshift structures of people displaced by drought at the Ladan internally displaced people (IDP) camp in Dolow on May 1, 2023. Hassan Ali ELMI / AFP